Start here
What are you working on?
Try it now
Four hard ideas, made simple.
Read one. If it clicks, you'll know what learning with me is like.
Chemistry
What does "entropy" actually mean?
Textbooks call it "disorder," which confuses more than it explains. Here’s the simpler version: entropy counts how many equivalent ways a system’s energy and particles could be arranged and still look the same from the outside. Gas fills a room not because it "wants" chaos, but because there are astronomically more arrangements that look spread-out than arrangements that look neatly gathered in one corner.
Research
Why do lithium batteries grow dendrites?
When lithium ions land on the anode during charging, they rarely deposit perfectly evenly. A tiny bump concentrates the electric field, so the next ions preferentially land there too — and the bump snowballs into a needle-like spike. That’s a dendrite: not randomness, but a feedback loop, and it’s what my PhD research is actually trying to stop.
EIS
What is a Nyquist plot telling you?
Read it from left to right, high frequency to low. Where the curve first meets the axis is the ohmic resistance of electrolyte and contacts. The semicircle is charge transfer at the interface: a wider arc means a slower, more resistive surface. The sloped tail at low frequency is ions diffusing. Watch how each part grows with cycling and the plot tells you which part of the cell is ageing.
Programming
Why put battery data in a database?
A single cycling campaign can produce millions of rows spread across files in different cycler formats. Parse each format once into one SQLite database, and every analysis — capacity fade, dQ/dV, coulombic efficiency — reads the same clean table, instead of re-cleaning spreadsheets every time you ask a new question.
Why you can trust this
10+ yrs
Teaching chemistry: making hard ideas clear
2 + 2
Research papers published · patents filed
Python · Blender
Data pipelines and 3D schematics, built in-house
PhD
Lithium-metal anodes · Chungnam National University
Stay in touch
Electrochemistry, made clear, by email.
New videos, data-analysis tips, research notes and tools, sent when they're ready. No spam, and you can unsubscribe any time.
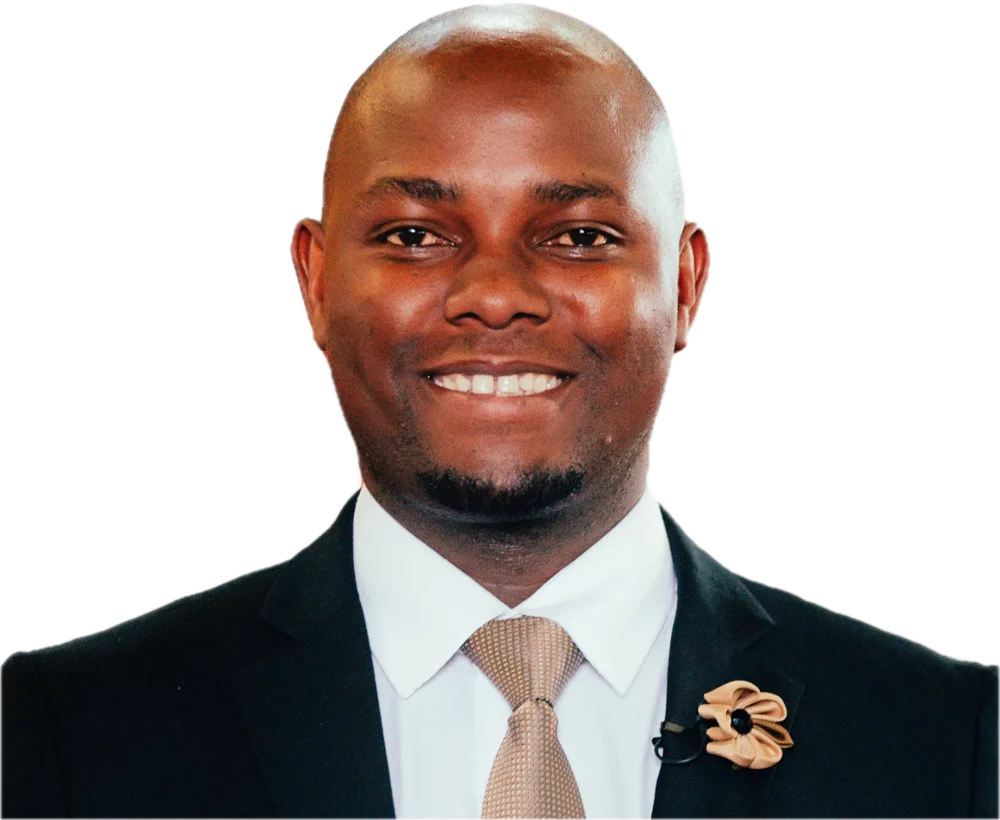
I trained as a chemical engineer in Zimbabwe and taught A-Level Chemistry in Bulawayo while I was still a student. I went on to teach Cambridge Maths and Chemistry in Harare before moving to Korea for graduate research.
Today I'm doing a PhD on lithium-metal anodes, writing Python tools for battery data, and rendering lab processes in 3D. Both the lab and the classroom taught me the same thing: people don't need more information. They need someone to make it clear. That's what this site is for.
What is your data trying to tell you?
Send a dataset, a confusing plot or a failed cell. I read every message.